Research / Measuring the ROI of Sales Incentive Programs
“Post-Hoc Experiments” and “Outcome-Based Measures”
Although most people would agree that sales incentive programs are valuable, ask for measurable “proof” and you’ll have a debate on your hands. The debate centers on “causality” and isolating the sales incentive program as the “cause” from other possible influencers, such as increased advertising, improved marketing conditions, reduced pricing, etc.
The ideal method for isolating causality is field experimentation — measuring the outcomes of an experimental group (e.g., incentive program participants) versus a control group (e.g., those who did not participate). If both groups share market conditions, advertising, etc., these other influencers (potential causes) can be negated. The closer the groups are matched, the greater the integrity of the analysis.
In the business world, time/money, labor resources, political and other pressures can create obstacles to setting up experimental and control groups before a program is implemented. Exercising the scientific method of field experimentation “after the fact” using historical data is the approach referenced herein as “Post-Hoc Measurement.” Through this process, experimental and control groups are set up using historical performance data.
Similar difficulties and the need for a broader view of results from a business operations perspective may suggest “Outcome-Based Measures” be used. For example, in addition to sales increases, outcome-based measurement considers such areas as accounts receivable and inventory levels that can be affected by sales improvements. In this way, the measures are tracked before, during and after the program.
This report summarizes these two methodologies using cases selected from companies that have implemented measurable sales incentive programs in the past. Through the cases summarized here (and in the full study), sales incentive program professionals will gain insights into understanding the data requirements with respect to these two ROI measurement methodologies.
An Office Equipment/ Office Products Company offered two incentive programs to its distribution channel partners. “Program A” provided an incentive for Dealer Salespeople to sell the company’s products; “Program B” promoted the purchase and stocking of the company’s products by Dealer Principals.
Salespeople and Dealer Principals responded to a Web-based survey asking if they participated, how those who participated viewed the program, etc. Their responses were correlated with demographics such as dealership size (large versus small) and type (multiline versus exclusive). With these data, control and treatment groups were derived such that Salespeople and Dealer Principals who had a “claim” (participated in the program) could be compared with those who did not have a claim (did not participate).
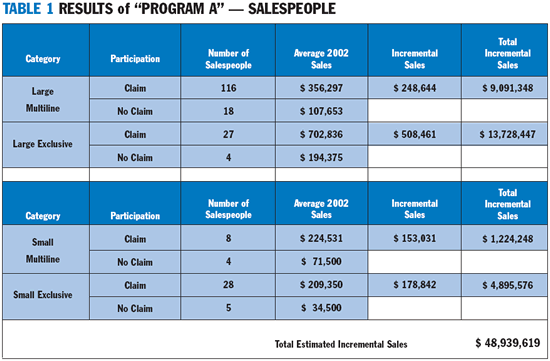
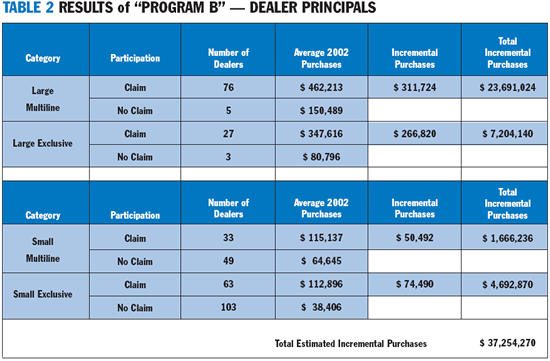
Tables 1 and 2 show the number of Salespeople and Dealer Principals within each sub-category according to dealership size and type.
As shown in Table 1, the “Average 2002 Sales” for Salespeople in all categories of firms who participated in the program (Claim) exceeded the average sales of non-participating (No Claim) Salespeople in all categories of firms.
As shown in Table 2, “Average 2002 Purchases” were higher among incentive program participants (Claim) versus non-participants (No Claim) in all categories of firms. Total incremental purchases attributable to incentive “Program B” were $37.2 million.
Assuming a gross margin of 20 percent on dealer purchases (and using the incentive program cost estimates provided by the company), “Program B” had a strong financial impact at the dealership level.
Note: Although all dealers purchased from the company (and could thus be considered “participants”) some dealers had Sales Representatives who did not participate (No Claim). For that reason, dealers who had salespeople who did not participate were considered to be a “pseudo control group.”
Since the manufacturer paid for both programs, but received revenue only from product purchases made by the Dealer Principal, the ROI (impact) from the manufacturer’s perspective is:
|
Basis:
|
|
Profit From Incremental Sales to Dealers
|
|
Cost of “Program A” + Cost of “Program B”
|
|
Calculations:
|
|
Incremental profit from product sales to Program investments: ROI: |


A Hand Tools Manufacturer awarded points to its 126 distributors for the attainment of sales goals, invoice payment duration, shipping date flexibility and enrollment within sales training programs.
Following discussions with managers in these functional areas, baselines were developed. Since the company had never implemented a sales incentive program before, the goal was to establish a benchmark based upon last year’s sales. With that information, projections could be generated, taking into account factors such as the economy, industry and customer trends.
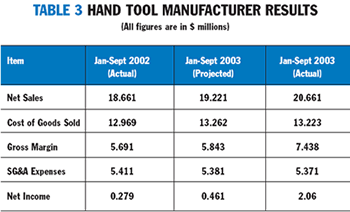
In addition to sales improvement, the manufacturer wanted to improve accounts receivable and inventory turnover. Thus, awarding points for the attainment of invoice payments and shipping would have an impact on the company’s SG&A Expenses. Table 3 presents the overall program results.
Projected sales figures in column 3 (Jan. – Sept. 2003) were based on extending the firm’s historical sales trends after considering various economic, industry and customer factors. Before 2003, the company had not implemented a sales incentive program; thus, the projected figures for Jan. – Sept. 2003 serve as the benchmark because these numbers represent the anticipated results without the incentive program. The incentive program resulted in a net sales gain of roughly 7.5 percent.
Costs incurred to achieve the sales numbers were held in check. The cost of goods sold (including cost of carrying inventory) and the SG&A Expenses (which include the cost of unpaid invoices) remained at or near the previous levels. This resulted in a significant increase in the net income derived from the sales. The following were also outcomes:

Post-hoc and outcome-based measurement approaches can be implemented without undue strain on an organization in terms of political climate, expense, etc. For incentive program designers and practitioners, attention to data collection, level of analysis, group/subgroup setup and more are needed. To implement a post-hoc or outcome-based measurement methodology, keep in mind these key points:
Study Design & Evaluation: Be sure to understand the full mix of products and product differences as they relate to participants and nonparticipants.
Groups and Sub-Groups: Match experimental and control groups as closely as possible and consider all variations that may exist within your groups.
Data Collection: Pay careful attention to ensure data integrity. Identifying important, relevant variables —such as program costs and margin information— is critical.

Our panel discussed the new Incentive Travel Index data and how incentive professionals are delivering outstanding incentive travel programs despite the budgetary constraints.

The outlook for non-cash rewards in 2025 remains positive across both North America and Europe. North American economic optimism rebounds from near historic lows to 23%, signaling a stronger outlook for 2025.